Blink Electricity Monitor
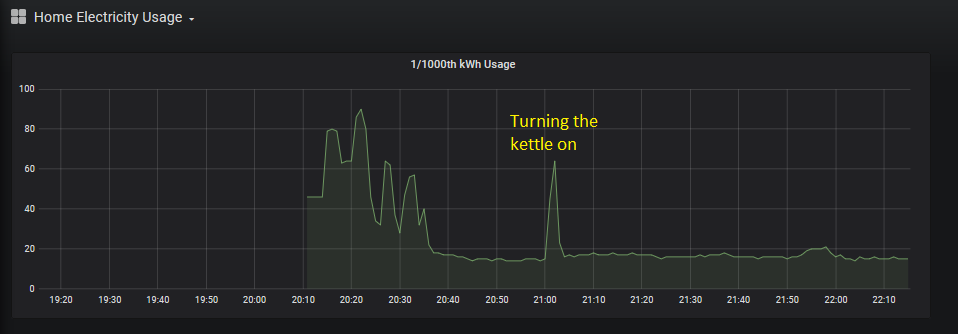
Summary: Using an Ardunio to count the number of blinks from the electricity meter in the flat and eventually convert that into live and historical electricity usage graphs. On the meter I have (a EDMI ES-10B), one blink represents 1/1000th of a Kilowatt-hourkWh.
The hardware
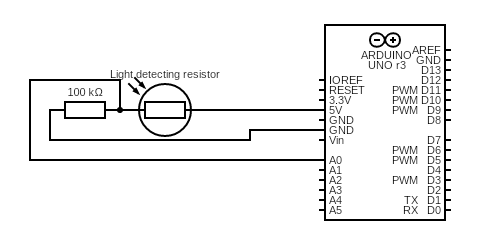
It's a really simple circuit, basically connect the light dependent resitor (LDR) to the 5V pin on the Ardunio, then connect back to GND with a 100k resistor between the LDR and GND. Connect the analog data pin (A0) just after the LDR.
Then, upload some code to the Ardunio to count the number of blinks. You might need to tweak the delay and the sensorValue depending on your electric meter LED type. These values worked for me.
int sensorPin = A0;
int sensorValue = 0;
int blinkCount = 0;
int cutOff = 600;

void setup() {
  Serial.begin(9600);
}

void loop() {
  sensorValue = analogRead(sensorPin);
  if(sensorValue > cutOff) {
    String strSensorValue = String(sensorValue);
    blinkCount++;
    String output = strSensorValue + " (" + blinkCount + ")";
    Serial.println(output);
    delay(100);
  }
  delay(100);
}
That gives me the data in the format:
Apr 05 22:07:28 977 (3787)
Apr 05 22:07:32 976 (3788)
Apr 05 22:07:36 978 (3789)
Apr 05 22:07:39 976 (3790)
Apr 05 22:07:43 976 (3791)
Apr 05 22:07:47 975 (3792)
To dump this to a file, on the Linux box (or Raspberry Pi) the Arduino is plugged into, you need to use stty set the baud rate, then just use cat to read directly from the Ardunio (I also use ts to prefix each line with a timestamp):
stty -F /dev/ttyACM0 9600
cat -s /dev/ttyACM0 | awk NF | ts > electricmeter.log
If you have any issues with permissions, make sure your user is in the dialout group.
Each line corresponds with a blink of the meter, so I use some PHP to basically count the number of lines in a minute (this runs in a cron job every minute):
<?php
$data = `tail -n 100 /tmp/electric_meter.log`;
$lines = explode("\n", $data);
$current_ts = date("H:i", strtotime("-1 minute"));
$mycounter = 0;
foreach($lines as $line) {
        $fields = explode(" ", $line);
        if(is_array($fields) and sizeof($fields)>3) {
        $datetime = date("H:i", strtotime($fields[2]));
        $luminosity = $fields[3];
        $counter = $fields[4];
        if(date("H:i", strtotime($datetime)) == $current_ts) {
                $mycounter++;
        }
        }
}
$full_payload = "kwh used=$mycounter";

$url = INFLUX_SERVER_ADDRESS;
$ch = curl_init($url);
curl_setopt($ch, CURLOPT_RETURNTRANSFER, true);
curl_setopt($ch, CURLOPT_POSTFIELDS, $full_payload);
$response = curl_exec($ch);
curl_close($ch);
That data is dumped to an influxdb every minute, then plotted in Grafana:


